Harvesting success - now measurable with the CropAnalyser!

Welcome to GRIMME - a 5th generation family business that is shaping the future of agriculture with the development of digital technologies!

One of these technologies is the CropAnalyser. This high-precision sensor enables farmers to record by-products and the size spectrum of the potatoes and the resulting potato yield for each variety and sub-area in real time during the harvesting process.in a fully data-driven harvesting process, resources can be used more efficiently and better decisions can be made for the next harvest.

You can find out more about how the CropAnalyser works on the following slides or see the news.

Step 01: Multi-wavelength laser profiling

Step 01: Multi-wavelength laser profiling

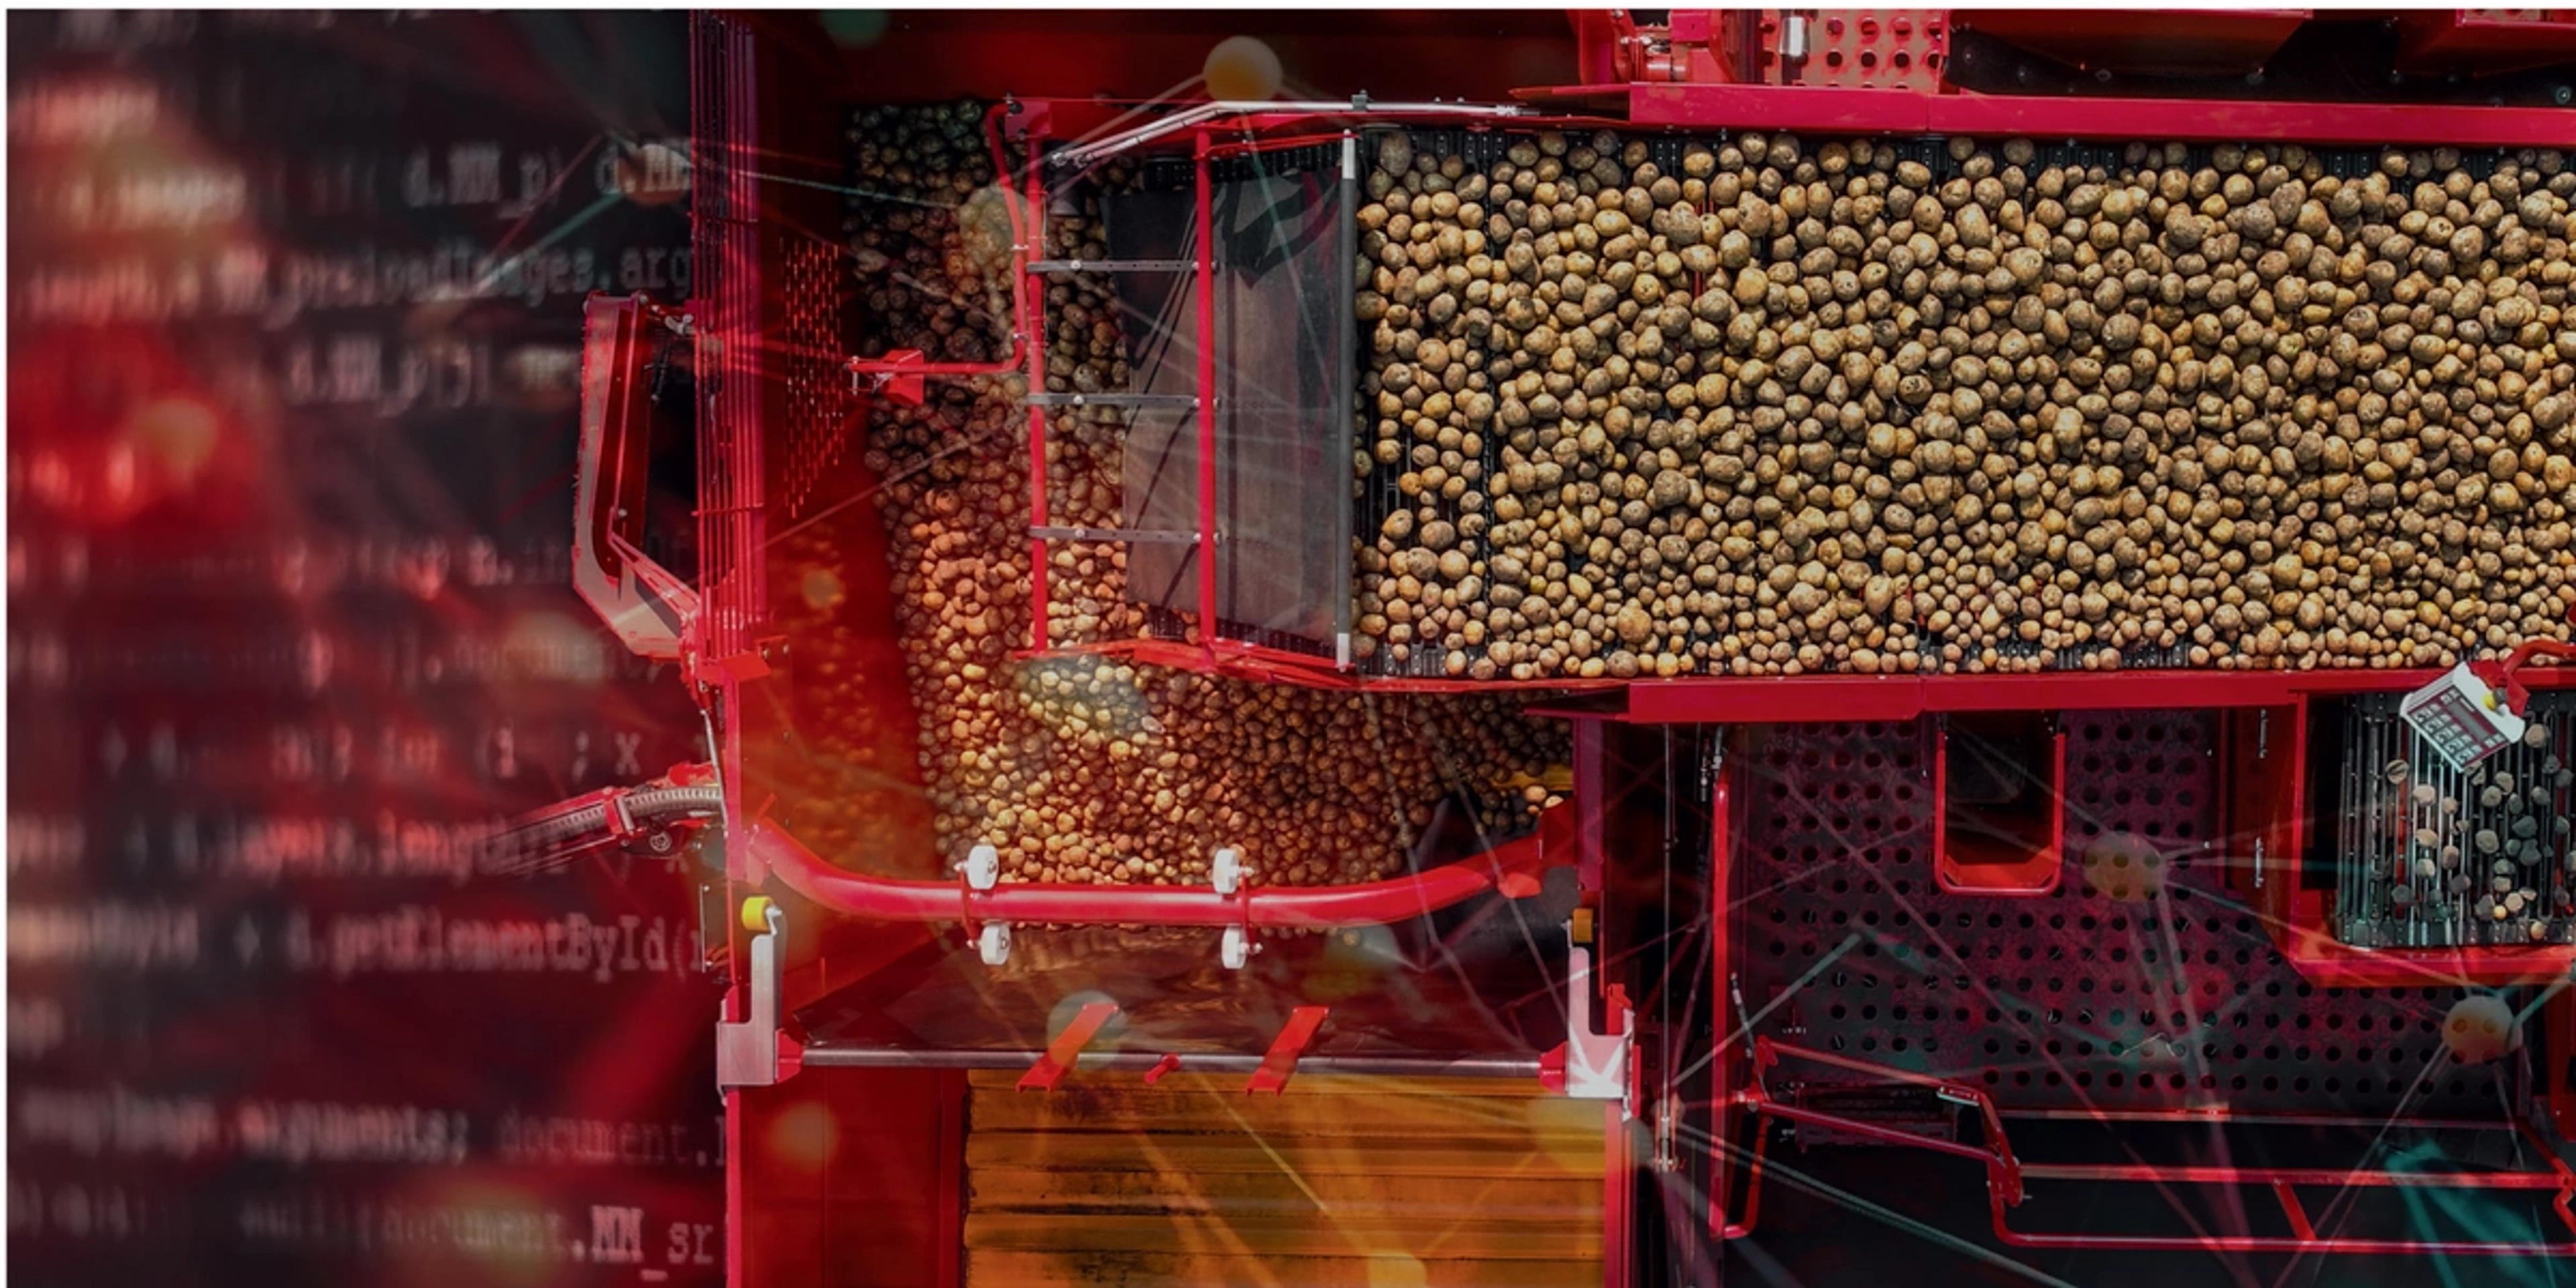
The objects on the conveyor belt are detected using lasers, with the scattered laser line being recorded in a camera image. The scattering varies depending on the type of object: for example, it differs between potatoes containing water and stones or soil, which enables precise identification.

Step 02: Calculation of the 3D point cloud

Step 02: Calculation of the 3D point cloud

The high-frequency scanning of the laser lines during the movement of the conveyor belt creates a 3D point cloud of the objects using the light section method. In the case of the potatoes, these are the respective potato tops, which are then used to estimate the volume.

Step 03: Pixel-by-pixel classification

Step 03: Pixel-by-pixel classification

This is followed by a pixel-accurate classification that distinguishes between potatoes and additions. Various channels are used for this purpose, which result from the reflective properties of potatoes and admixtures, among other things.

Step 04: Panoptical segmentation

Step 04: Panoptical segmentation

The results of this classification serve as input for the panoptic segmentation in order to differentiate between individual object instances. The inference of the two neural networks takes place segment by segment on individual image sections. In a downstream processing step, the objects are merged across several images in order to subsequently calculate their mass and square dimensions based on the 3D scan.

Step 05: Yield mapping

Step 05: Yield mapping

The measurement data is processed and forwarded to the CCI terminal via ISOBUS. They are also visualized in the myGrimme customer portal and in the GRIMME SmartView system, which enables direct analysis of mass, square dimensions, number of potatoes and admixture proportions in the field. With the help of the "agrirouter" data exchange platform, the data from the CropAnalyser can be transferred to other systems, such as farm management information systems, in a standardized way.

Tech Stack

A small selection of technologies we work with

C / C++

CAN, J1939, IsoBus

Matlab

Linux

Azure DevOps

Python

ROS

MQTT

Docker

Our development locations

Curious to get to know us?

Feel free to contact us if you are interested in a job in our team.